From Greta Thunberg’s many appearances, to the yearly conferences, to the UN Sustainable Development Goals, climate change has become a global hot topic.
In the United States, climate change has also raised a concern for Americans and has influenced U.S. legislations, with the emergence of new programs such as the Green New Deal.
To understand how climate change actually affects the life of Americans across the continent, Wise Voter sets out to compare the 50 states on five key dimensions: Carbon Emissions, Green Tech Adoption, Landfill Usage, Recycling, and Green Policies. These dimensions are ranked using 43 relevant metrics.
Read on to find out which states are the greenest in the American soil.
Rankings: Best & Worst States for Climate Change
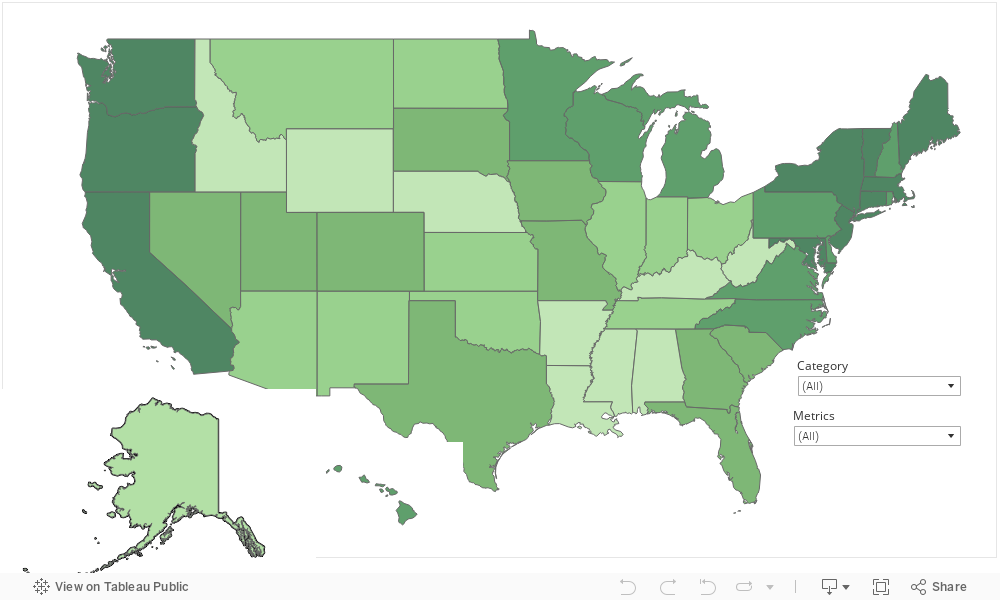
Category Breakdown

Methodology
To rank the best and worst states for climate change in the U.S., Wise Voter compared the 50 states across five key dimensions:
- Carbon Emission
- Green Tech Adaption
- Landfill Usage
- Recycling
- Green Policies
We gauged the six dimensions using 60 relevant metrics listed below with their corresponding weight. Each metric was graded on a 100-point scale, with a score of 100 being the max.
One last note, we ruled each state’s weighted average across all metrics to calculate its overall score and employed the resulting scores to rank-order our sample.
Carbon Emission (30 points)
Total Energy Consumption: Regular Weight (1.94 points)
Total energy consumption per capita.
Change in Carbon Intensity of Economy: Double Weight (3.87 points)
Percentage change of CO2 emissions per state annual GDP from 2015 to 2019.
Carbon Intensity of Economy: Double Weight (3.87 points)
Amount of CO2 needed to be emitted to generate annual GDP in 2019
Change in Individual CO2 Emissions: Double Weight (3.87 points)
Percentage change of individual CO2 a person emitted from 2015 to 2019 in metric tons.
Individual CO2 Emissions: Double Weight (3.87 points)
Amount of individual CO2 a person emitted in 2019 in metric tons.
Change in Residential CO2 Emissions: Regular Weight (1.94 points)
Percentage change of residential CO2 emissions from 2014 to 2019.
Change in Transportation CO2 Emissions: Regular Weight (1.94 points)
Percentage change of transportation CO2 emissions from 2014 to 2019.
Change in Commercial CO2 Emissions: Regular Weight (1.94 points)
Percentage change of commercial CO2 emissions from 2014 to 2019.
Change in Industrial CO2 Emissions: Regular Weight (1.94 points)
Percentage change of industrial CO2 emissions from 2014 to 2019.
Change in Coal Burning Emissions: Half Weight (0.97 points)
Change in the amount of CO2 emissions by burning coals from 2014 to 2019 in million metric tons
Change in CO2 Emissions for Electricity Production: Regular Weight (1.94 points)
Percentage change in the amount of CO2 emissions from generating electricity from 2014 to 2019 in million metric tons
Exposure to Poor Air Quality: Regular Weight (1.94 points)
Average exposure of the public to particulate matter of 2.5 microns or less measured in micrograms per cubic meter from 2018 to 2020.
Green Tech Adoption (20 points)
EV Charging Station: Half Weight (1.00 points)
Number of electric vehicle charging stations per capita.
Wind Energy: Double Weight (4.00 points)
Wind energy facilities installed capacity per megawatts in 2020.
Solar Energy: Regular Weight (2.00 points)
Solar energy consumption by trillion Btu in 2019 per capita.
Hydro Energy: Double Weight (4.00 points)
Hydro energy consumption by trillion Btu in 2019 per capita.
Biomass Energy: Regular Weight (2.00 points)
Biomass energy consumption by trillion Btu in 2019 per capita.
Geothermal Energy: Half Weight (1.00 points)
Geothermal energy consumption by trillion Btu in 2019 per capita.
Fuel Cell Energy: Regular Weight (2.00 points)
States that promote public-private partnership in generating fuel cell energy.
Clean Energy Job: Double Weight (4.00 points)
Percentage growth of clean energy job from 2018 to 2020.
Landfill Usage (10 points)
Landfill Availability: Half Weight (1.25 points)
The number of existing landfills per capita.
Individual Waste: Double Weight (5.00 points)
The amount of landfills buried per capita.
Food Waste: Regular Weight (2.50 points)
Share of wasted food per total food surplus.
Zero Waste Store: Half Weight (1.25 points)
Number of zero waste stores available per capita.
Recycling (15 points)
Packaging Materials Recycling: Double Weight (3.00 points)
Percentage of recycled containers and packaging materials in 2018.
Plastics Recycling: Double Weight (3.00 points)
Percentage of recycled rigid plastics in 2018.
PET Bottles Recycling: Regular Weight (1.50 points)
Percentage of recycled pet bottles in 2018.
Aluminum Cans Recycling: Regular Weight (1.50 points)
Percentage of recycled aluminum cans in 2018.
Steel Cans Recycling: Regular Weight (1.50 points)
Percentage of recycled steel cans in 2018.
Glass Bottles Recycling: Regular Weight (1.50 points)
Percentage of recycled glass bottles in 2018.
Battery Recycling: Regular Weight (1.50 points)
States that have collected the largest weight of batteries per state’s population.
Food Recycling: Regular Weight (1.50 points)
Share of food that’ve been recycled or donated.
Green Policies (25 points)
CO2 Reduction Target: Double Weight (3.85 points)
States with a government-initiated target to reduce greenhouse gas emissions.
Carbon Pricing: Double Weight (3.85 points)
States with carbon pricing policies.
Clean Energy Policies: Double Weight (3.85 points)
Renewable energy policies and incentives by state.
Battery Recycling Laws: Regular Weight (1.92 points)
States that mandate batteries be recycled or at least require battery makers to fund battery recycling.
Clean Cars Standards: Regular Weight (1.92 points)
States that adopt California’s Clean Cars Standards.
Single-Use Plastic Bag Ban: Regular Weight (1.92 points)
States that have adopted a law that restricts or bans plastics for single use.
Recycling Laws: Regular Weight (1.92 points)
States that have adopted a or more recycling legislations.
Curbside Recycling Programs: Half Weight (0.96 points)
Number of municipalities that have or will have stopped curbside recycling programs since 2018.
Bottle Bill: Regular Weight (1.92 points)
States that implement a container redemption program.
Food Waste Ban: Regular Weight (1.92 points)
States with food waste ban policies, in scale from no policy to strong policy.
Date Labeling on Food: Half Weight (0.96 points)
States that require certain types of food products be labeled, in scale from no policy to strong policy.
Sources: Data employed to render “Best & Worst States for Climate Change” report were garnered from U.S. Energy Information Administration, U.S. Department of Energy, U.S. Census Bureau, U.S. Department of Agriculture, U.S. Bureau of Economic Analysis, Nebraska Department of Environment and Energy, U.S. Environmental Protection Agency, National Weather Service, National Oceanic and Atmospheric Administration, U.S. Geological Survey, Maryland Department of the Environment, researches from accredited academic institutions, credible nonprofits, and private research firms whose researches have been cited by governments and mainstream news organizations.